Details
-
Bug
-
Resolution: Unresolved
-
 Low
Low
-
4.6.2
-
None
-
None
-
Ibexa Commerce, Ibexa Content, Ibexa Experience
-
Yes
Description
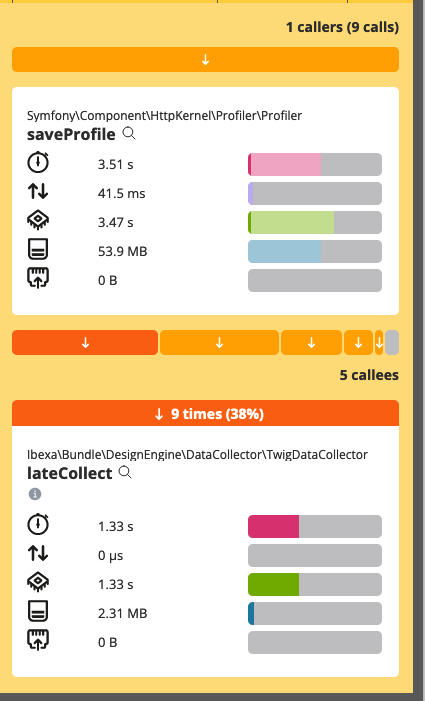
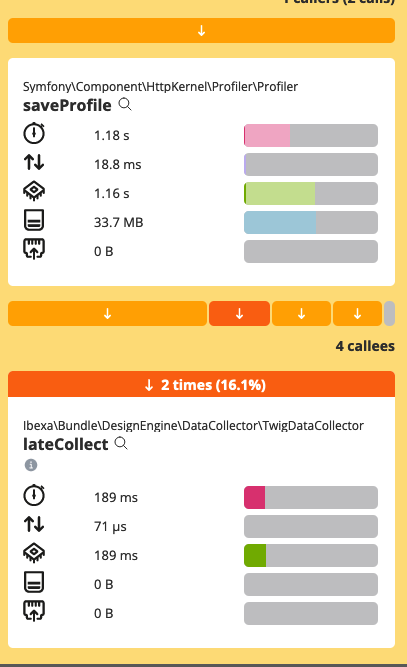
When using Symfony's web profiler, the performance of the dashboard decreased in 4.6.1 compared to 4.5.4 because the \Ibexa\Bundle\DesignEngine\DataCollector\TwigDataCollector::lateCollect() has much more to do in 4.6.1 than in 4.5.4, see screenshots (higher durations for 4.6.1).
4.5.4
4.6.1

Additionally data from the twig profiler view:
4.5:
- 630 ms Render time
- 354 Template calls
- 772 Block calls
- 595 Macro calls
4.6:
- 1318 ms Render time
- 605 Template calls
- 1295 Block calls
- 897 Macro calls
Note:
Issue is not necessarily a bug - but worth to check for possible improvements.